Breaking

Pet Age Staff//December 3, 2025//

Pet Age Staff//December 3, 2025//
The American Pet Products Association (APPA) has announced the release of its 2025 Bird, Small Animal & Horse Report, its fourth pet owner insights report this year. The report features the latest research and insights from APPA’s National Pet Owners Survey on bird, small animal and horse owners, providing over 200 pages of comprehensive analysis and visuals on owner shopping trends, sentiment, demographics and behaviors.
The data shows a dynamic shift across the bird, small animal and horse categories, driven largely by changing generational behaviors and deepening human-animal bonds.
Gen Z emerges as a major force in bird and small animal ownership, while Millennials strengthen their position among horse owners. In-person shopping preferences remain strong across all three groups, alongside a notable rise in online shopping.
“Across birds, small animals and horses, we’re seeing growing enthusiasm and deeper engagement from today’s pet owners,” said APPA president and CEO, Pete Scott. “Generational growth and new purchasing patterns demonstrate these categories expanding in meaningful ways and creating fresh opportunities for the pet care industry.”
The 2025 Bird, Small Animal & Horse Report highlights emerging trends shaping these ownership categories, where six million U.S. households own birds, six million own small animals, and two million own horses.
Key insights revealed in the report include:
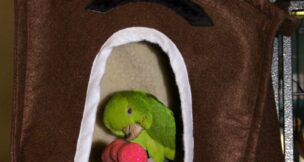
Bird Ownership Trends
Ownership
Gen Z is ruffling feathers, with bird ownership becoming increasingly popular among the youngest generation of pet owners. Among bird owners, parakeets are the most popular type of bird, and cockatiel ownership rebounds.
Shopping Habits
Bird owners maintain a strong connection to bird stores, relying on them not only as a primary source for their pets but also for trusted expertise and essential supplies.
Gift Giving
Most bird owners (76 percent) give gifts to their birds, underscoring just how deeply the human-animal bond resonates with feathered family members.
Small Animal Ownership Trends
Ownership
Small animals are hopping into the spotlight as Gen Z’s newest companions. At the same time, rabbits are the most popular type of small animal owned, with their numbers increasing over time, particularly among Gen X and Boomer owners.
Shopping Habits
Small animal owners have a strong connection to pet superstores, both when selecting their pets and purchasing essentials.
Gift Giving
Most owners (87 percent) give gifts to their small animals, reflecting the strong emotional connection they have with their pets.
Horse Ownership Trends
Ownership
Millennials are taking the reins among horse owners, acquiring more horses, and holding the majority of horse ownership across all generations.
Shopping Habits
Horse owners prefer to shop in person, particularly at feed stores; however, a growing number of owners are opting to shop online.
While owners still primarily shop at feed stores, an increasing number of owners are purchasing products online or directly from manufacturers.
Gift Giving
Most horse owners (73%) give gifts to their animals, highlighting both the bond owners have with their horses and their investment in care beyond the basics.
“This year’s data shows a generational handoff unfolding in real time among bird, small animal and horse owners,” said Ingrid Chu, APPA’s vice president of research insights. “Gen Z and Millennials are developing new habits and shopping patterns, all of which point to a new era of growth and opportunity in these pet categories.”
The American Pet Products Association is a membership organization that serves the pet industry through services and programs designed to help its members thrive and prosper. Since 1988, APPA has published the APPA National Pet Owners Survey, the premier resource of its kind, providing in-depth data on consumer behavior. APPA’s research and insights monitor consumer habits, identify short- and long-term trends and discover new opportunities in pet ownership, pet product and service consumption, published across four quarterly reports, including State of the Industry, Dog & Cat, Fish & Reptile and Bird, Small Animal & Horse.