
 Free Newsletter


Little girl chooses house for puppy in pet shop. Kid plays in petshop, goods for domestic animals
A Closer Look at U.S. Pet Industry’s 2019 Sales
Pet Age Staff //April 1, 2020//


According to John Gibbons, president of A GPS for Pet Businesses, Global Pet Expo was the forum for a major announcement from the American Pet Products Association (APPA). The revenue for the Total Pet Industry in 2019 was stated to be $95.7 billion. This was a huge change from 2018 numbers of $72.56B. The difference “is a result of APPA’s efforts to refine and improve its research methodology. In some cases, categories have been revised to include services or products that were previously excluded as reliable data was difficult to obtain.”
The APPA also produced revised numbers for 2018 so a comparison between the 2 years is possible. They reported that in 2018 the Pet Industry totaled $90.50B. That is $17.94B (24.7%) more than they had previously reported. That is a big revision. Let’s put an $18B increase in Consumer Spending into better perspective. $18B is 40% more than we spent on bread in 2018 and about equal to the spending on each of these categories …
- Fresh & frozen chicken
- Fresh Milk & Cream
- Coffee & Tea at home
- Beer & Wine “out on the town”
- All non-prescription drugs
- Non-business computers & hardware
That is a big gap in data. We can’t compare current data to years earlier than 2018 so in effect 60 years of Pet Spending History has been wiped out. It has also been removed from the APPA website so, we are left with the “here and now”…
In 2019 the APPA reported $95.7B for the Total Pet Industry. This is a $5.2B (5.75%) increase over $90.5B in 2018. As we have done in the past, we will take the APPA Retail numbers and figure in the impact of inflation or deflation so that we can see the true change in the amount of goods and services.
Since 2009 and the Great Recession, inflation has not been a big factor in the Pet Industry. In fact, both Food & Supplies have had multiple years of deflation since then. The Services segments have also dialed back their price increases to a certain extent. 2017 saw an all-time record low inflation rate of 0.4% for Total Pet. In 2018, it moved up slightly to 1.25% but in 2019, it almost tripled to 3.25%, the highest rate since 2009. Increasing prices can slow consumer spending in discretionary segments, like Supplies. In Veterinary Services spending, strong inflation has reduced the frequency of visits, especially among lower income groups.
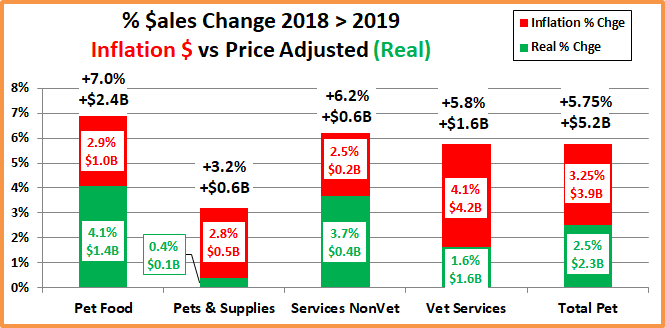
Here are the specifics from 2019.
Pet Food and Services had the best year of any groups but still over 40% of the spending lift came from price increases.
- Pet Food – In 2018 Pet Food prices deflated slightly, -0.02% so a CPI increase of 2.88% in 2019 was a big turnaround. However, the segment still generated a relatively strong “real” increase of 4.09%.
- Pet Services – There has been strong competitive pressure in this segment as more outlets began offering services. This expansion may have stabilized as inflation returned to a more “normal” rate of 2.51% for this segment. The demand for Services is still there as real growth of 3.68% was the second best of any industry segment.
- Veterinary – The Veterinary segment is known for strong inflation. Since they began measuring it in 1997, Veterinary prices have increased at a rate 35% faster than human medical care. The inflation had slowed in the last two years, but it bounced back in 2019 with a rate of 4.14%, the highest rate since 2011 and 18% higher than human medical care. We see the impact on the numbers as over 71% of a 5.8% Retail increase was from prices.
- Supplies – Since the great recession, many categories in this segment have been commoditized. This means that inflation/deflation noticeably affects consumer spending. The tariffs which began late in 2018 drove prices up 2.83% in 2019. As a result, real growth was only 0.38% as prices accounted for over 88% of a 3.2% increase.
This makes it readily apparent that the major driving force behind the increase in Retail Pet $ in 2019 was inflation. This is somewhat of a surprise compared to recent years. Since 2009, the depth of the great recession, the average annual inflation rate for Total Pet through 2018 was 1.31%. During the same period, the overall U.S. annual inflation rate averaged 1.76% so Total Pet was a relative “value” compared to other consumer expenditures. However, as we all know by now, we need to look deeper. While both of the Services segments maintained an inflation rate above the national CPI, Total Pet prices were driven down by 5 deflationary years in both Food and Supplies. In fact, Supplies’ prices in 2018 were 4.3% below the level in 2009. In 2019 Total Pet Inflation jumped up to 3.25%, 148% higher than the average of the previous 9 years. Is it any wonder that it was such a big factor in spending?
As we have seen in our demographic analysis of Pet Spending from the US BLS Consumer Expenditure Survey, money (income) is the single biggest factor in increased spending. Price changes can cause significant changes in spending behavior in the more discretionary segments. Since 2009 Supplies have been on a spending roller coaster as prices moved up and down in the short term. Veterinary inflation has caused a reduction in visit frequency and depressed spending in lower income groups. The Services Segment is the most discretionary, but an increased number of outlets and the resulting competition have reduced inflation and driven big increases because pet parents do like and want the convenience of Services. For years, Pet Food was immune from the impact of inflation. After all, you don’t buy more pet food than you need just because it is cheaper. Then came the era of Super Premium Foods. At first, these foods were only available at an exceptionally high price so the first wave of consumers to upgrade were generally better educated with higher incomes. Then came a savior, (or demon, if you prefer) the internet. Suddenly prices were more affordable for more people. The mass market stores also stepped in. The overall increased competition flattened and even deflated prices, so a new wave of Super Premium upgrades produced a much deeper market penetration of this food category.
Now, let’s get back to the present. Although we can’t compare 2019 to any year other than 2018, we can look back to the beginning of the Pet Industry and compare it to the industry’s long term growth, even with the revised numbers.
The earliest data that we have from any source is from the US BLS Consumer Expenditure Survey in 1960. Total Pet Spending in that year was $1.08B. That may seem incredibly small but becomes believable when you consider…
- 57% fewer H/Hs (73m less)
- Only 40% of H/Hs had a pet
- Value of $1 in 1960 was $8.64
Let’s do the math and compare the long term Retail $ & Real Growth rates to the 2018>2019 increase:
- Average annual retail growth
- 1960 > 2018: +7.9%
- 2018 >2019: +5.7%
- Average “Real” annual growth
- 1960 >2018: +4.2% (53.2%)
- 2018 >2019: +2.5% (43.4%)
Obviously, 2019 wasn’t an auspicious start to a new “era”. The lower retail growth is understandable as it becomes more difficult to maintain a % growth rate over a long period. The big concern is the percentage of growth that is real. It was below 50%, which is certainly below the norm. To generate a “normal” year, the growth in 2019 needed to be +$6.3B, $1.1B more than we got. Veterinary inflation needs to be dialed back and we need relief from tariffs on Supplies.
Now, we have an unexpected and even bigger factor, COVID-19. The rapidly growing pandemic has had an immediate and sometimes devastating impact on the U.S. marketplace. Together, we will get through this health and business crisis. However, the long term impact on consumer spending behavior is unknown. We’ll just have to wait and see.
See the full report here.


