
 Free Newsletter


Report: 2018 Pet Services Spending $8.72B
Pet Age Staff //February 21, 2020//


According to John Gibbons, president of A GPS for Pet Businesses, pet services are by far the smallest segment at $8.72B but in 2018, they made the most “noise”. Spending increased $1.95B (+28.9%). This was by far the biggest increase in history. The number of outlets offering services has been strongly increasing in recent years as brick ‘n mortar retailers look for a way to combat the growing influence of online outlets. After all, you can certainly buy products, but you can’t get your dog groomed on the Internet. This created a highly price competitive market for pet services. In 2017 there was a slight increase in visit frequency, but pet parents just paid less. This resulted in a 1.0% decrease in services spending. In 2018 consumer behavior changed as a significant number decided to take advantage of the increased availability and convenience of pet services and spending literally took off.
To better appreciate the significance of this huge spending lift, let’s put it into historical perspective. The $1.95B increase in pet services spending was larger than the total annual spending for the segment for every year prior to 1999. It was also more than twice as big as the previous largest increase of $0.82B in 2012. This is great news as pet services now has a stronger “presence” at the pet industry “table” and pet spending becomes a little more balanced. Let’s look a little deeper into the demographics.
Let’s start by identifying the groups most responsible for the bulk of services spending in 2018 and the $1.95B increase.
- Race/Ethnic – White, not Hispanic (85.5%) down from 87.9%. This big group accounts for the vast majority of spending in every segment but services spending became slightly more diverse in 2018 as their performance fell from 128.3% to 123.8%. However, they are still tied for 5th in terms of importance.
- Number in CU – 2+ people (77.3%) down from 79.8%. The share of market for 2+ CU’s is very close for all segments but lowest in services and the only one with a share less than 80%. Their performance of 109.6% is down from 111.9% also last. The explanation is that singles had a great year. They are 29.5% of CUs and spent 44% more on services.
- Housing – Homeowners (80.8%) down from 86.4%. Homeownership is a big factor in pet ownership and spending in all industry segments. The homeowners’ share of services spending fell sharply in 2018 as did their performance, from 137.4% to 127.3%. Homeownership fell from 3rd to a tie for 5th in terms of importance for increased services spending. Homeowners w/mtge spent 34% more, but those w/o a mtge spent 5% less and … Renters $ were up 82%.
- Income – Over $70K (72.3%) up from 71.2%. This group’s performance rating is 179.4%, down from 185.2% but still shows that CU income is the single most important factor in increased pet services spending. The slight gain in share with a slight drop in performance can be explained by the slowly growing CU income. CUs under $70K spent 27% more on services but they had 2% fewer CUs. The over $70K spent 23% more but gained 6% in CUs.
- Education – College grads (68.9%) up from 68.8%. Income generally increases with education. Services spending moves up with each increasing level of education. This is why we again shifted the group up to college grads. Performance of 157.9% was down from 161.9% but a college education is still the 2nd most important factor.
- Occupation – All wage & salaried (71.4%) up from 64.1%. Last year we had a special group called “I’m the Boss” which consisted of mgrs and professionals, self-employed and retirees. This year regular workers took the lead. Their performance rating increased from 104.9% to 116.9%, but occupation is no longer a member of the influential 120% club. As many “non bosses” stepped up, services spending became more balanced in terms of Occupation.
- # Earners – “Everyone Works” (71.5%) up from (64.9%). All adults in the CU are employed. Income is important so a relatively high market share is expected. However, their performance grew to 123.8% from 113.3% and they returned to the 120% club at #5. This lift reflects the youth movement. Younger CUs generally have more earners.
- Age – 35>64 (63.7%) up from 61.0%. Their performance also increased significantly from 114.3% to 120.4%. A big lift in spending by the 35>44 yr olds caused the big spending group to grow younger from 45>74 yr olds. Services spending is becoming a little more balanced in this category, but age still ranks 7th in importance for services money.
- CU Composition – Married couples (62.8%) down from 64.5%. Married couples are a big share of money and have 120+% performance in all segments. Their performance fell to 126.6% from 130.3% but they moved up to 4th place in terms of importance to services spending. Married couples spent 25.5% more on services but that wasn’t as big a lift as the +44% by singles or even the +30% by single parents, so they lost a little ground.
- Area – City/Suburbs >2500 (85.3%) up from 79.8% in share, while performance increased from 97.7% to 104.7%. Last year the big group was all suburban. In 2018 central city virtually tied suburbs >2500 for the spending lead. To get 60% and properly reflect the urban trend in this segment, we combined those 2 groups.
We changed 3 of the groups for services – income, education and area – to better target the biggest spenders. Income is even more important to services spending than it is to veterinary, where we only changed income. The performance levels in services spending in categories related to income – income, number of earners, occupation and education – are markedly higher than veterinary which shows an even bigger spending disparity between the segments in services.
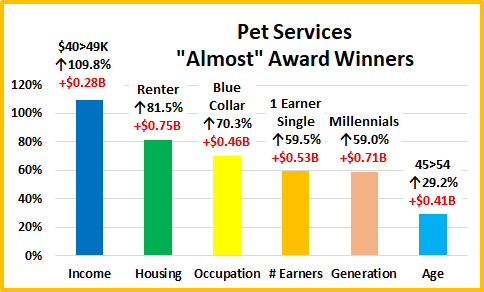
Now, we’ll look at 2018’s best and worst performing pet services spending segments in each category. Most of the best and worst performers are not a surprise. However, there are 8 that are different from 2017, the most of any segment – 4 of the best and 4 of the worst. Also, half the changes were in 2 categories – age and generation. The 4 new winners, Gen X, 35>44, enter city and married, oldest child < 6, do reflect the very definite “youth movement” behind the big 2018 lift in services spending. We should note:
- Income is even more important to pet services. While the 364.0% performance by the $200K> group is less than last year’s 398.8%, it is 41% higher than veterinary and 130% higher than the best performing income segment in food.
- Generation – Gen X took over the top spot from the Boomers and Millennials got off the bottom. It was a good year for the younger generations.
- Age – The 35>44 group reflects the youth movement. They are the best performers and spend the most $. It is also significant that the <25 group got off the bottom. All groups from 35>64 perform at 100+%. In 2017 it was 45>74.
- Area –Center city became the performance leader, going from 90% to 117.3%, and was within $0.02B of taking the spending money lead from suburbs >2500. Areas >2500 pop. were up $2B and accounted for 85.3% of total services money.
- CU Composition – Married Couples, with an oldest child <6 may seem like a surprise, but they won in 2016. They also had the biggest % increase of ANY segment, +152.6%. Marriage and children are important factors in services spending. Married couples only and those with children of any age all perform over 100%. They all earn their share.
In pet services spending performance, we see 2 major factors: income, which is not a surprise in this most discretionary segment, and youth, which is a surprise in a segment that has skewed older.
Pet services spending was up $1.95B, the biggest lift in history. There was a strong demographic impact as 9 of 12 categories had an individual segment that accounted for at least 47% of the increase. At the same time, the drops were small. The largest was only $0.17B. In fact, 6 of 12 categories had no segments that spent less. There were 7 repeats, 4 winners and 3 losers from 2017 but only 5 of 24 segments switched their position from first to last or vice versa, the same as supplies. All of this indicates little turmoil, just strong, widespread growth.
2018 was a fabulous year. In 6 categories all segments spent more. Moreover, the winning increase in each category averaged +$1.04B up from +$0.25B in 2017, while the biggest decreases averaged -$0.02B up from -$0.27B. That certainly shows a widespread lift . The major trend was definitely to the younger groups. Income reasserted its importance, certainly in terms of the number of earners. Singles definitely stepped up and we also saw a spending move back to more populated areas. The $1.95B increase was the biggest in history and we have detailed the winners in performance and money.
The services segment has usually been “above” changes in other segments. Since 2010, prices have steadily increased but so did spending …until 2017. An increase in outlets offering services created a much more competitive environment. While prices didn’t deflate, inflation slowed significantly, and “deals” abounded as retailers began a pitched battle for consumers’ services money. The net result was turmoil and a 1% decrease in spending. In 2018, the abundance of outlets and competitive prices finally had their intended impact. Many more consumers took advantage of the convenience of pet services and spending literally took off.
Pet services are definitely needed by some groups. However, for most demographics, services are a convenience and spending is very discretionary in nature. The result of this is that CU income is of paramount importance to increased services spending. This impacts many demographic categories and we adjusted the big spender groups in 2 categories specifically to accommodate this difference in behavior and to better target where most of the money is coming from. Just how important is income? 40.3% of CU’s have an income over $70K and account for 72.3% of services spending. This is a performance rating of 179.4% – the highest rating earned by any group in any category in any industry segment.
Performance is an important measurement. We identified 7 categories with high performing big groups. There were 6 for veterinary and supplies but only 4 for food. This indicates greater demographic disparity in services spending.
· Income · Occupation · Higher Education · Homeownership · CU Composition · Race/Ethnicity · Age
3 of these groups are directly related to income – education, occupation and income. However, for 2 – race/ethnicity and age – the consumer has no control over their inclusion. They can’t control their age, but it turns out that age was the single biggest factor in pet services spending in 2018. The biggest spending group changed from 45>74 to 35>64. However, it wasn’t just the added Gen Xers. The Millennials also stepped up.
Although the lift was widespread, as 91% of all demographic segments spent more on services, there was a big disparity in the amount spent. This is apparent as 10 of the 12 best performing segments also had the biggest $ increase and the average increase was $1B, up from $0.25B in 2017.
The youth movement was apparent in the improved performance of segments which reflect their demographics:
- Preference for urban areas
- Higher education
- More CU earners
- Presence of children…or singles
… to name a few. In 2018, the Gen Xers and Millennials stepped up and took a position of prominence in services spending and raised the visibility of the services segment.
At last – the “Ultimate” pet services spending consumer unit consists of 3 people – a married couple, with 1 child under 6. They are White, but not of Hispanic origin. At least one of them has an advanced college degree. They are 35 to 44 years old and both of them work, in managerial positions. They’re doing well with an income over $200K. They live in the center city of a metropolitan area of over 2.5 million in the Western U.S. and are still paying off their mortgage.
See full report here.


