Free Newsletter

Petflation 2022: March Update Examines Inflation in Pet Sector
Glenn Polyn //April 15, 2022//


It’s April and inflation continues to make headlines. According to John Gibbons, the Pet Business Professor and president of A GPS for Pet Businesses, there have been year-over-year increases in the monthly Consumer Price Index (CPI) larger than we have seen in decades. In March, the CPI was up 8.5 percent vs. 2021, the biggest increase since 1981. Food at Home (groceries) has a similar story. Prices were up 10 percent over 2021, the biggest increase and the only double-digit percentage increase in any month since 1981. As we have seen in recent years, even minor price fluctuations can affect consumer pet spending, especially in the more discretionary pet segments. With that in mind, the Pet Business Professor is publishing monthly reports to track petflation as it evolves in the marketplace.
Total Pet prices were 4.1 percent higher in December 2021 than in December 2020, while the overall CPI was up 7.0 percent. In March 2022, Total Petflation was up +7.5 percent vs 2021 and the overall CPI was +8.5 percent. The gap has significantly narrowed. In December the rate of Petflation was 58.5 percent of the national number. In March it was 88.2 percent. This and future reports will include:
- A rolling 24-month tracking of the CPI for all pet segments and the national CPI. The base number will be pre-pandemic December 2019 in this and future reports, which will facilitate comparisons.
- Monthly comparisons of 2022 vs. 2021 which will include Pet Segments and relevant Human spending categories. Plus
- CPI change from the previous month
- Inflation changes for recent years (20>21, 19>20, 18>19)
- Total Inflation for the current month in 2022 vs 2019
- Average annual Year Over Year inflation rate from 2019 to 2022
- YTD comparisons
- YTD numbers for the monthly comparisons No. 2>No. 4 above
In our first graph we will track the monthly change in prices for the 24 months from March 2020 to March 2022. We will use December 2019 as a base number in this and future reports so we can track the progress from pre-pandemic times through an eventual recovery. Inflation is a complex issue. This chart is designed to give you a visual image of the flow of pricing. You can see the similarities and differences in patterns between segments and compare them to the overall U.S. CPI. The current numbers plus those from 12 and 24 months earlier are included as are the year-end numbers for 2020 and 2021.This will give you some key waypoints for comparisons.
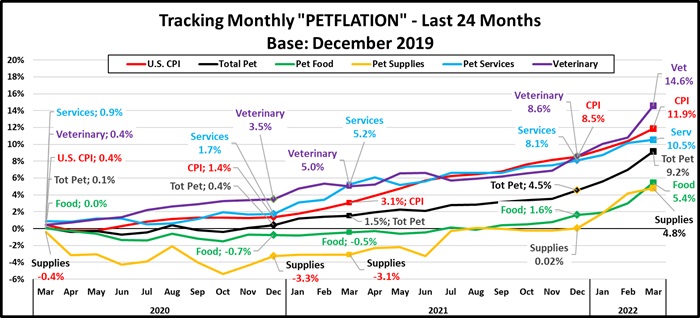
The pandemic began in March 2020. At that time, you see that inflation was not an issue. There are two distinctly different patterns between the two services segments and the two products segments. Although there are some ups and downs, Veterinary and Services prices generally inflated after mid-2020, a pattern similar to the overall CPI. Food and Supplies prices generally deflated until late 2021. After that time, inflation took off. In March the rate of increase over the prior month slowed for Services and Supplies but accelerated for Food and Veterinary. Here are some things to note:
- S. CPI – The inflation rate was below 2 percent through 2020. It turned up in January 2021 and continued to grow stronger through March 2022. 88 percent of the overall 11.9 percent increase since 2019 occurred in the last 15 months.
- Pet Food – Prices stayed generally below December 2019 levels from April 2020 to September 2021, when they turned up. There was a sharp increase in December. 86 percent of the 5.4 percent total has happened since November.
- Pet Supplies – Remember that Supplies prices were high in December 2019 due to the added tariffs. They had a “deflated” roller coaster ride until mid-2021 when they returned to December 2019 prices and essentially stayed there until 2022 when they turned sharply up reaching a new all-time pricing high in January, beating the 2009 record. They have continued to set new price records in February and now March.
- Pet Services – Normally inflation is about 2+%. Perhaps due to closures, prices increased at a lower rate in 2020. In 2021 consumer demand increased but there were fewer outlets. Prices increased strongly in 2021 with the biggest lift coming in January>April. Inflation got even stronger in 2022 but the rate slowed a little in March.
- Veterinary – Inflation has always been something that you can count on in Veterinary Services. Prices began moving up in March 2020 and grew consistently through the 2021 recovery. Then a pricing surge began in December which pushed them past the overall CPI with total inflation since 2019 reaching +14.6 percent.
- Total Pet – The blending of the segment patterns made the Pet Industry appear calm compared to the overall market. That ended in December 2021 as prices surged for all segments. In March, Food & Vet were the drivers.
Next, we’ll turn our attention to the Year over Year inflation rate change for the month of March and compare it to last month, last year and to previous years. We’ve added some human categories to put the pet numbers into perspective.
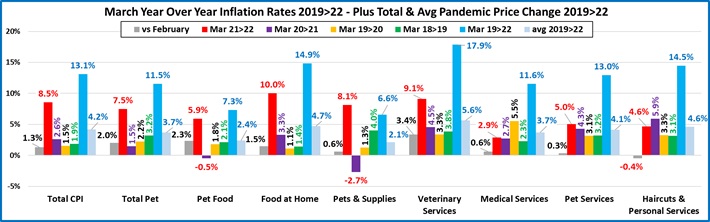
Overall, prices vs. 2021 were up 8.5 percent vs 2021 with the Grocery increase now hitting double digits. There are some small positives. Only five of nine categories had price increases over 1 percent from last month. It was six in February. Plus, the price for Haircuts & Other Personal Services was up 4.6 percent vs. 2021 but actually down from January. There is a little hope.
- S. CPI – Prices are up 1.3 percent from February. The targeted inflation rate is less than 2 percent. In March, prices were up 8.5 percent, more than four times higher than the “targeted” rate. Overall Inflation is getting worse.
- Pet Food – Prices are up 2.3 percent vs. February and 5.9 percent vs. March 2021. They are being measured against a deflationary year, but that increase is almost triple the pre-pandemic 2.1 percent increase from 2018 to 2019.
- Food at Home – Prices are up 1.5 percent from February. The increase from 2021 is 10 percent, which is the largest March increase and the only double digit monthly percentage increase for any month since 10.3 percent in March 1981. Inflation for this category since 2019 is still 10+ percent more than the national CPI.
- Pets & Supplies – Prices were up 0.6 percent from their record in February, setting a new record. March prices are being compared to deflated prices in 2021 but the increase only trails Food at Home, Veterinary and the national CPI.
- Veterinary Services – March prices are up an incredible 3.4 percent from February. This pushed them up 9.1 percent from 2021, more than twice the increase in past years. They also took over the top spot in the increase since 2019, +17.9 percent.
- Medical Services – Prices sharply increased at the start of the pandemic in March 2020 but then inflation slowed and returned to a more normal rate in 2021 and 2022.
- Pet Services – Inflation slowed in 2020 but began to grow in 2021 and 2022. Prices are up 0.3 percent from February and 5 percent from 2021, slowing slightly from a record 6.5 percent increase in February, but still above the increase of previous years.
- Haircuts & Other Personal Services – Prices fell from February but remain higher than usual since 2020.
- Total Pet – The inflation rate is getting larger and is now five times the rate of last year. Food & Veterinary are driving it up as it gets ever closer to the national CPI rate of increase. Inflation has caused problems in the past by reducing the frequency of purchase in Supplies, Services and Veterinary. Super Premium Food has been generally immune as consumers are used to paying big bucks and it is needed every day. We’ll see if consumers are still willing to pay the higher prices for more discretionary products and services at the same frequency as they did in the past.
Now here’s a look at Year to Date numbers. How does 2022 compare to previous years?
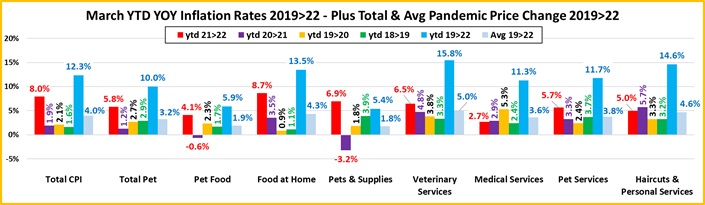
The increase from 2021 to 2022 is the biggest for seven of nine categories. The average annual increase since 2019 is over 3 percent for all but Pet Food and Pet Supplies. This is due to deflation in 2021.
- S. CPI – The current increase is double the average increase from 2019>2022, but over four times the average annual increase from 2018>2021. Inflation is a big problem that started recently.
- Pet Food – Inflation is growing stronger, especially after deflation in 2021.
- Food at Home – The 2022 YTD inflation beat the overall CPI. You can clearly see the impact of supply chain issues.
- Pets & Pet Supplies – Prices have strongly turned up since the beginning of the year. Although the 2021>22 increase is being measured against a deflationary 2021, it is very significant and the highest of any Pet Industry segment.
- Veterinary Services – Has the most inflation since 2019 and is the only segment on the chart in which the inflation rate has consistently grown each year throughout the pandemic and recovery. No matter what, just charge more.
- Medical Services – Prices went up significantly at the beginning of the pandemic, but the rate has slowed since and is now essentially returned to pre-pandemic levels.
- Pet Services – Inflation slowed a little in March after February’s largest year over year monthly increase in history. However, the current YTD increase remains second only to 6.6 percent in 2009. Demand has grown for Pet Services while the availability has decreased, a formula for inflation.
- Haircuts & Personal Services – The services segments, essential and non-essential were hit hardest by the pandemic. Now as consumers move closer to their normal patterns of spending, including value shopping, prices actually fell in March. The YTD inflation is still high but moving closer to a more normal rate.
- Total Pet – When we first looked at the pandemic impact on Petflation. We saw basically two different patterns. Prices in the Services segments continued to increase, and the rate accelerated as we moved into 2021. The product segments – Food and Supplies, were on a different path. They generally deflated in 2020 and didn’t return to 2019 levels until mid-year 2021. Food prices began a slow increase, but Supplies remained stable until we neared yearend. In 2022, everything changed as Food and Supplies prices turned sharply up. In March, inflation in the two largest segments – Food and Veterinary, accelerated while it slowed in Supplies and Services. This pushed the YTD CPI increase vs 2021 for Total Petflation ever closer to the extraordinarily high rates in the overall market.
Inflation is radically increasing in the Pet Market. Will it impact spending? Let’s put it into perspective. The 5.8 percent YTD increase in Total Pet is far below the 10.3 percent record set in 2009 but almost four times larger than the 1.5 percent average since then.
Although pet spending continues to move to higher income groups, the impact of inflation varies by segment. Supplies is the most affected. Many categories are commoditized and very price sensitive. Super Premium Food has become widespread because the perceived value has grown. Higher prices just push people to value shop. Veterinary prices have strongly inflated for years, resulting in a reduction in visit frequency. Spending in the Services segment is driven by higher incomes, so inflation is less impactful. We’ll just have to wait and see the impact of the latest surge in Petflation.