
 Free Newsletter


2018 U.S. Pet Services Spending Up $1.95B
Pet Age Staff //October 23, 2019//


By: The Pet Business Professor
According to John Gibbons, president of A GPS for Pet Businesses, except for 2017, non-vet pet services has shown consistent growth in recent years. However, in 2018, the performance was spectacular. Spending grew $1.95B to $8.72B, a (+28.9%) increase from 2017.
The number of outlets offering pet services has been increasing at a rapid rate. It looks like that this commitment really paid off in 2018.
In this report we will drill down into the data to see what groups fueled the biggest spending increase in history for this segment. (Note: All numbers in this report come from or are calculated by using data from the US BLS Consumer Expenditure Surveys.) Services’ spending per CU in 2018 was $66.36, up from $52.06 in 2017. (Note: A 2018 Pet CU (67%) Spent $99.04)
More specifically, the 28.8% increase in total pet services spending came as a result of:
- 1% more households
- Spending 21.11% more money
- 24% more often
Despite a return to a more normal inflation rate, +2.4%, more people opted to use pet services and to do it more often. This generated by far the biggest spending increase in history for this segment, +$1.95B, which came from strong growth in both halves. Now, let’s look at some specific spending demographics. First, by income group.
In 2018, all income groups increased spending and the $30>70K group spent 38% more, but 70% of the increase came from $100K+ CUs. Services spending is still driven by income as the $100K+ group, 25.8% of CU’s, spends 59.8% of the money.
- <30K (28.7% of CU’s) – $20.45 per CU (+5.5%) – $0.77B, Up $0.01B (+1.4%)
This segment is getting smaller and money is tight. However, even they managed to eke out an increase in CU spending and overall services $. - $30>70K (31.0% of CU’s) – $40.33 per CU (+38.6%) – $1.64B, Up $0.46B (+38.4%)
This group dialed back their spending on food but they spent the “saved” money on other segments, especially services. - $70>100K (14.5% of CU’s) – $57.26 per CU (+14.5%) – $1.09B, Up $0.13B (+13.1%)
They cut back spending on products and focused on services and veterinary. However, their services spending is still below the 2014 level. - $100>150K (13.1% of CU’s) – $108.59 per CU (+19.8%) – $1.87B, Up $0.38B (+25.1%)
They cut back on food $ and focused on the other segments, including a second consecutive strong increase in services $. - $150K> (12.7% of CU’s) – $200.45 per CU (+20.2%) – $3.34B, Up $0.99B (+41.8%)
They have long been the driver in services spending. After a minor dip in in 2017, they came back with a $1B increase in 2018.
Although we had to take the numbers to 3 decimal places, all age groups also spent more on services in 2018. However, the increase was clearly driven by the <55 groups, especially the 35>44 year olds. Here are the specifics:
- 75> (10.4% of CU’s) – $30.69 per CU (+3.3%) – $0.42B – Up $0.03B (+7.3%)
This group has the greatest need for pet services, but money is always an issue. The competitive values made a huge difference in 2017. In 2018 they “got a good price” and significantly ramped up their frequency.9% more CU’s spent 15.7% less $, 22.5% more often. - 65>74 (14.7% of CU’s) – $64.35 per CU (-3.6%) – $1.243B – Up $0.006B (+0.5%).
This group is also very value conscious. They were the only age group to decrease CU services spending. However, they grew in numbers and increased purchase frequency, so they eked out a small gain. 2% more CU’s spent 8.2% less $, 5.0% more often. - 55>64 (18.6% of CU’s) $66.96 per CU (+2.8%) – $1.64B – Up $0.03B (+1.9%)
In 2016 they took over the #1 spot in services spending. They fell to #3 in 2018. Despite decreasing in CU’s, they basically held their ground while spending in the younger groups exploded. 9% less CU’s spent 2.1% more $, 0.7% more often. - 45>54 (17.5% of CU’s)- $83.24 per CU (+32.1%) – $1.92B – Up $0.43B (+29.2%)
This highest income group was the leader in services spending until 2016. They spent a lot more in 2018, but not enough to beat the new leader, 35>44-year-olds. 2% fewer CU’s spent 36.6% more $, 3.3% less often. - 35>44 (16.7% of CU’s) – $90.81 per CU (+85.4%) – $2.0B – Up $0.96B (+93.3%)
Spending fell in 2016. They began to recover in 2017, but spending took off in 2018. The group grew in size, but their income grew even more, +11.3%. Obviously, they spent some of the extra $ on services. 3%, more CU’s spent 73.5% more $, 6.9% more often. - 25>34 (16.2% of CU’s) – $55.53 per CU (+35.2%) – $1.18B – Up $0.31B (+35.3%)
In recent years this group of millennials focused first on upgrading food and then supplies and veterinary. During this time, services’ spending has been essentially flat. In 2018 it was services’ “turn” as9% less CU’s spent 10.7% more $, 22.2% more often. - <25 (5.8% of CU’s) – $42.19 per CU (+133.4%) – $0.32B – Up $0.18B – (+133.3%)
With increases in every segment, this small, youngest group became a “player” in 2018. The same number of CU’s spent 137.5% more $, 1.8% less often.
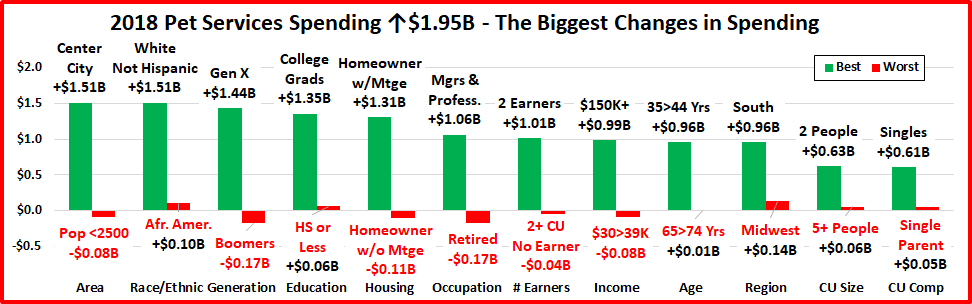
Pet services is the most discretionary of all the industry segments, so income is the most important factor in spending. Although the spending lift was widespread across income groups in 2018, the biggest driver was the $100K+ CU’s. This dependence on income is reinforced by some of the winners in our chart above, including:
- Managers and Professionals
- $150K+ Incomes
- 2 Earners
- College Grads
On the downside, here are 5 groups with decreased spending that have a common thread:
- Retirees
- 2+ CU, No Earner
- Homeowner w/o Mtge
- $30>39K Income(avg. for retirees)
- Baby Boomers– A specific subgroup of Boomers drove the decreases
For the younger baby boomers pet services’ spending was basically flat, +$0.03B. It is the older boomers, specifically those who have retired, that drove most of the few demographic spending decreases in the services segment.
2018 was a year like no other in the history of pet services spending. To put the $1.95B increase into perspective, the previous biggest gain was +$0.8B in 2009. In fact, total spending for the services segment didn’t even break the $2 billion barrier until 1999.
So, what caused this eruption in spending? We saw the impact in 2018, but it actually has been building for a few years. In an effort to counteract the impact of the internet and the mass market, more and more pet outlets began offering pet services. After all, “You can’t get your dog groomed online.” “One-stop shopping” is always a great draw for consumers. Retailers began applying this to pet products and services. Convenience…which included a rise in mobile grooming.
The “movement” didn’t show immediate positive results. We saw some turmoil in 2017, as services spending actually fell -$0.07B, quite a rarity. The increased number of outlets caused some pricing pressure. Consumers are always looking for a good deal. In 2017 they found it. It didn’t change their overall behavior or spending frequency; they just paid less.
However, in 2018 the convenience message finally hit home across the market. Significantly more consumers began using pet services for the first time or more often. We’ll see if the segment can maintain this new level.
See the full report here.


