Free Newsletter


U.S. Pet Services Hit $6.77B in 2017
Pet Age Staff //October 17, 2018//


By John Gibbons, The Pet Business Professor
Non-Vet Pet Services has shown consistent growth in recent years. In 2017, spending fell $0.07 billion to $6.77 billion, a (-1.0 percent) decrease from 2016. This was the first drop since the Great Recession in 2010. It is a minor decrease, but as we drill deeper, we will once again find that consumer pet spending behavior is becoming increasingly more complex. All numbers in this report come from or are calculated by using data from the US BLS Consumer Expenditure Surveys.
Services spending per household (H/H) in 2017 was $52.06, down from $52.77 in 2016. More specifically, the decrease in Total Pet Services spending came as a result of:
- 0.3 percent more households
- Spending 1.6 percent less dollars
- 0.3 percent more often
The chart below gives a visual overview of recent spending on Pet Services
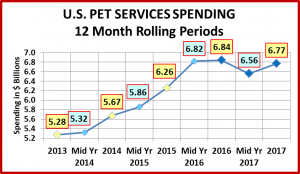
The growth was consistent until mid-year 2016. In the second half of 2016, spending flattened out and then fell sharply in the first half of 2017. The second half of 2017 saw a spending rebound, but it was not quite enough. The pattern over the last 18 months coincides with a radically lower inflation rate. It appears that the price sensitivity in this segment is growing. Now, let’s look at some specific spending demographics. First, by Income Group.
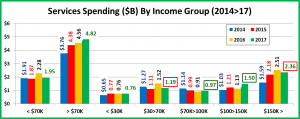
In 2017, the upper middle income groups spent more but it wasn’t enough to overcome the spending decrease by two disparate groups: H/H’s just below the average income and the upper tier, over $150,000. Since 2014, the spending by the $30>100K group is down while the high and low end groups are both up. However, 92 percent of the increase came from the $100+K group. Services spending is still driven by income as the $100+K group, 23.6 percent of H/H’s, spends 42.2 percent of the dollars.
- <30K (30.2% of H/H’s) – $19.38 per H/H – $0.76B, Up $0.004B (+0.5%) – This segment usually doesn’t have the money to spare for Services. However, they were one of only two segments to increase H/H spending by +3.2%.
- $30>70K (31.4% of H/H’s) – $29.11 per H/H – $1.19B, Down $0.33B (-21.9%) – This group dialed back their discretionary spending on Supplies to help offset a big spending increase in all other segments.
- $70>100K (14.9% of H/H’s) – $49.99 per H/H – $0.97B, Up $0.5B (+5.7%) – They actually spent slightly less per H/H on Services. The small spending lift in total $ came from a 6.2% increase in the number of H/H’s.
- $100>150K (12.7% of H/H’s) – $90.67 per H/H – $1.5B, Up $0.37B (+32.3%) – There was a 29% lift in H/H spending on Services by this group, which indicates both new users and an increase in frequency by existing users.
- $150K> (10.9% of H/H’s) – $166.79 per H/H – $2.36B, Down -$0.16B (-6.2%) – Their H/H Pet Services spending fell 9.7%, which shows that even the wealthiest Americans appreciate a value.
Now, let’s look at spending by Age Group.
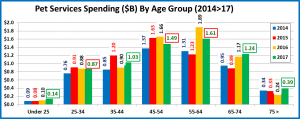
The Age demographic also reflects a truly “mixed bag” in spending. Perhaps the key observation is that the 65+ group, the fastest growing segment, is spending significantly more on Services. Here are the specifics:
- 75> (10.2% of H/H’s) – $29.71 per H/H – $0.39B – Up $0.15B (+63.5%): This group has the greatest need for pet services but money is always an issue. The competitive values available made a huge difference in 2017. Up 63.5% can’t be ignored. 1.4% more H/H’s spent 60.4% more, 0.5% more often.
- 65>74 (14.3% of H/H’s) – $66.72 per H/H – $1.24B – Up $0.07B (+5.6%): This group is also very value conscious but 2017 was certainly their year for pets as they were the only age group to increase spending in every pet industry segment. In Services, the lift was small, but 1.8% more H/H’s spent 13.8% more, 8.8% less often.
- 55>64 (19.0% of H/H’s) $65.12 per H/H – $1.61B – Down -$0.28B (-14.8%): In 2016, they had a huge lift in Services spending, taking over the #1 spot. In 2017 they turned their attention to the other segments. They cut back on services spending primarily by value shopping as 0.3% more H/H’s spent 13.3% less, 2.1% less often.
- 45>54 (18.1% of H/H’s) – $63.00 per H/H – $1.49B – Down -$0.17B (-10.4%): This group has the highest income and until 2016 was the leader in Pet Services spending. In 2017, these regular users took advantage of the available values in the competitive market, which is obvious as 2.0% fewer H/H’s spent 12.6% less, 4.6% more often.
- 35>44 (16.2% of H/H’s) – $48.98 per H/H – $1.03B – Up $0.13B (+14.7%): While they haven’t fully recovered from the huge drop in 2016, the competitive situation in 2017 at least got them back in the game. The group size was smaller (-1.7%), but they spent 3.6% more money. However, it was most significant that they spent it 12.5% more often.
- 25>34 (16.4% of H/H’s) – $41.06 per H/H – $0.87B – Down – $0.002B (-0.2%): This group of Millennials is also value conscious. In 2016, they upgraded their Food. In 2017 they spent more on Supplies and Veterinary. Throughout this time, Services spending has been essentially flat. In 2017, 2.0% more H/H’s spent 4.3% more, but 6.2% less often.
- <25 (5.8% of H/H’s) – $18.08 per H/H – $0.14B – Up $0.04B – (+37.2%): Pet Services is low priority to the youngest Pet Parents, but the 2017 market got their attention. 3.9% more H/H’s spent 12.9% more, 17.5% more often.
Finally, let’s take a look at some other key demographic “movers” behind the 2017 Pet Services Spending decrease.
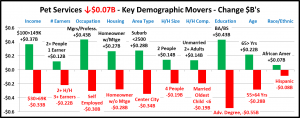
SUMMARY: The overall spending decrease was minor but the graph above gives some idea of the tumult that was going on within demographic categories. Fifty-three percent of individual demographic segments spent less on Pet Services in 2017, while 47 percent spent more, so the ups and downs were relatively evenly divided.
In the graph above, about half of the winners are expected groups, like High income and:
- managers and professionals
- two-people H/H’s
- College grads
- Homeowners w/mortgages
However, there are some definite surprise winners, especially:
- 65+ years: This growing group definitely has a need for services, but usually not the money. This is very significant.
- African Americans: have only 4.5% of the Services business. White, Non-Hispanics account for 88%.
- 1 Earner, 2+ H/H’s: Many H/H’s in this group have strong financial pressures, making it an unusual win.
- Rural Suburban (<2500 Pop): Services $ are skewed towards more urban areas but this group increased spending by 39%.
There are some surprises in the “losers” column, too.
- Self-employed and 3+ earner households have higher income which usually means more Services Spending, not less.
- Center City: Pet Services got their start in this area. A big drop is unusual to say the least.
- Advanced Degrees: The biggest surprise. This is the second best performer in Services of ALL demographic segments.
So, what caused all this turmoil? In a word, competition. In 2017, there was a significant increase in the number of retail outlets offering pet services. For pet stores, the addition of pet services was one way to counteract the impact of the internet and the mass market. More and more outlets began offering “one stop shopping” for all your pet needs. Convenience is a big consumer driver. However, the #1 driver remains price/value. The increased competition encouraged retailers to offer deals as they fought to gain new customers and keep existing ones. We saw this in the Services CPI. While it was not deflating, it had the second lowest increase since they began keeping records. Only 2010 had a smaller increase, which was due to the Great Recession.
So how can this affect Services spending? Lower prices and “deals” can attract new users or encourage existing customers to buy more or more often. Both of these increase revenue. However, it can also result in regular users spending less for the same services. There is another factor at work in Services Spending. It is the most discretionary of all the segments. This can result in consumers trading out Service $ to use in another segment, like a food upgrade. In 2017, we saw “all of the above” which created the turmoil. Spending fell slightly in 2017, but we should remember: there were more users and they bought more often. They just spent a little less for their Services. This is not all bad news. What will happen next? In May of 2018 the Services CPI rose 2.5 percent—the biggest increase ever. We’ll wait and see…