2016 Pet Age Retailer Report
Tom Mazorlig //January 6, 2016//
 Judging by the respondents to the 2015-2016 Pet Age Retailer Survey, the pet industry is in great health.
The survey for the 2015-2016 Pet Age Retailer Report was sent via email to pet retailers throughout the country to gauge the state of the independent pet retail industry.
Net profits went up in 2014 for 65 percent of respondents, with 35 percent reporting that profits rose by 10 percent or more.
Stores reported healthy growth in gross dollar volume in 2014. Overall, 70 percent of stores reported increased growth. That’s up from 41 percent of stores reporting an increase in 2013.
Growth Categories
Dog-related products are once again the leaders in growth. The fastest growing product category was all-natural treats for dogs. This category was reported as fastest growing by 16 percent of respondents. This was followed by dog food in general. Grooming products was the third fastest growing category. Most grooming products are intended for dogs, so the entirety of the top three fastest growing product categories are related to dogs.
Bre Wyatt, manager at Village Pets & Supplies in Santa Rosa, Calif., agrees on the popularity of all-natural treats.
“I agree that all-natural treats are growing,” Wyatt said. “There’s a huge market for all-natural, along with grain free, organic, gluten free – anything like that.”
A majority of stores carried dog and cat food, which is a good business practice because most stores that carried those products also reported an increase, whether slightly or greatly.
On the other hand, a large majority of stores indicated that they did not carry food or supplies for fish, birds, small animals or reptiles and also did not carry gift/specialty items. Interestingly enough, many of these categories seem to be opportunities for more business—in fact, all but the bird category—as most stores that carried them reported an increase in business.
Most respondents plan to expand their dog toy selection, with grooming products coming in at second place.
Livestock
In last year’s report, 30 percent of respondents said they carried live animals. This year, that number is 22 percent, showing a possibly significant decline. There has been a trend of fewer stores indicating that they sold live animals, with 36 percent saying they did so in the 2013-2014 Pet Age Retailer Report. From these responses, stores carrying live animals declined by 39 percent from 2012 to 2014.
There is a possibility that this drop reflects the nature of the survey.
“We specialize in aquatic hard-goods, and in actually calling on tropical fish and marine and reef stores, we have seen a larger variety of livestock this year over last,” said Andy Black, associate/partner at Market Strategies, an independent pet retail rep company. “In the aquatic category we have also seen a steady increase in retail outlets each year since 2010, more so than the prior five years going back to 2005.”
“The independent fish stores may not be taking the time to respond to survey requests,” said RD Webster, associate/partner at Market Strategies. “Plus, I hear from many of them they don’t read the trade magazines because of the focus on dogs and cats. Many small independent chains are dry goods only stores and they are much more inclined to be involved with the trade magazines and reports. This has been a year of great freshwater livestock and planted tank success.”
Of those stores that carry livestock, freshwater fish and invertebrates remain the most common. The percentage of retailers that carried these animals in 2014 was virtually unchanged from 2013, with 66 percent carrying in 2014 versus 69 percent in 2013.
The relative popularity of other types of livestock remains similar as in last year’s report.
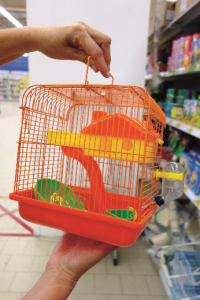
Of the stores that sell live pets, those that carry birds saw a significant drop from 54 percent in the last report to 47 percent in this one. However, birds were still the third most commonly stocked type of pet.
Pet stores that do carry livestock can generate a lot of sales. It may be best to support certain categories and to differentiate your store from other local retailers.
“Livestock has been good for us,” said Gene Schreib, owner of Pampered Pets in Ithaca, N.Y. “We do a lot with reptiles. That’s been really strong for us on both the supply end and the livestock end. In the last year, we’ve done really well with hedgehogs. We sell them like crazy.”
Stores and Services
Nearly the same percentage of respondents indicated they were planning on making store improvements in this year’s survey and last year’s survey – 56 percent versus 55 percent, respectively. Forty-one percent of those retailers planning store improvement intend to redecorate and/or update the store’s cosmetics, and this was the most popular response. Remodeling was the second most popular response at 37 percent. Thirty-three percent of respondents planning store improvements intend to spend more than $20,000 on those improvements.
Grooming is by far the most common ancillary service offered by respondents, with 54 percent of stores including grooming. It was also the number one choice last year, at 56 percent.
Delivery is the number two most common service offered by pet retailers; 25 percent of stores offer this service. This is up from the number four response at 19 percent in last year’s survey.
“Our home delivery service is critical to the long term health and viability of the business,” said Aaron Cohn, general manager at Bark ‘n Purr Pet Center in Austin, Texas. “Twenty years ago, offering total coverage of even a small city like Austn would have taken a chain of several stores. Now, I at least have the potential to reach all of those consumers from a single location. There is considerable investment up front, but less than that of a second store with far more potential.”
Last year, aquarium or pond installation/maintenance was the second most common service offered, but this year, this service fell to the fifth most commonly offered service. However, the percentage of respondents offering this service did not change a lot. Last year, the percentage was 23 and this year it was 18.
Twenty-two percent of respondents said they are planning to add services to their stores’ offerings in 2016. This is only slightly lower than the response in last year’s report, 29 percent. This year and last year, of the stores planning to offer new services in the coming year, delivery was the most common planned service, with nearly the same percentage giving this answer – 33 percent last year and 34 percent this year.
The second most common service that stores plan to add was obedience and/or agility training. This differs from the number two response last year, which was grooming. Last year, obedience and/or agility training was only the sixth most common response, so the popularity of training is on the rise among respondents.
Eighteen percent of stores that are planning to add a new service in 2016 want to offer self-service dog washing.
“We are hoping we can add a self-service dog wash,” Wyatt said. “They are popular with customers. We have one at our other location, and it is doing very well.”
Marketing Trends
When asked what form of advertising produced the best results for their business, the number one answer from our respondents was internet/website/email marketing/social media, with 45 percent giving this answer. The number two response was referral/word of mouth at 24 percent. Next was direct mail/coupon mailers with 10 percent. None of the other seven choices broke double digits.
That pet retailers find online marketing effective comes as no surprise to Sarah Julian, owner of OffLeash Communications.
“Online marketing can be a very cost effective way to generate awareness, engage consumers and advertise products and services,” Julian said. “The most successful retailers, however, will be the ones that can mobilize their online community, drive traffic into their stores and deliver a shopping experience that engenders customer loyalty.”
Looking at 2016
The big concern among the respondents is competition, specifically with big box stores, mass market stores and online retailers. Forty-nine percent indicated that this would be their biggest challenge in 2016. This response was also the biggest concern in last year’s survey, with close to the same percentage of respondents –52 percent – choosing this as their answer.
Online retail may be a particular concern – a greater one than even the big box pet stores.
“I would say, we have more competition with online than with big box,” Schreib said. “We’ve survived PetsMart, but now people check what they can get online. I’m finding that’s the biggest competition right now.”
The second most popular response for 2014 was a tie between finding/training/retaining new employees and increasing sales volume, with 30 percent of retailers giving this response.
Schreib agreed that finding the right person to fill an opening can be difficult.
“Right now I’m lucky that I’ve got some employees who’ve been with me a couple years,” Schreib said. “Finding new help is awful. It’s hard to find reliable people who want to do some work. There are a lot of people who think they are knowledgeable about pets but really aren’t. It’s hardest to find someone who is interested in and knows about the fish.”
The third most common answer was the economy at 27 percent. This is a change from last year’s report in which the economy was the second most common response with 37 percent, indicating it was the biggest challenge.
While it’s impossible to know what the hot trends in 2016 will be, Wyatt has an educated guess.
“Raw food seems to be taking off,” she said. “Lots of people are learning about dog and cat nutrition now, and many of them are going away from dry kibble and to a new route.”
About the Survey
Statistical data for the 2015-2016 Pet Age Retailer Report was compiled by Best Companies Group.
Pet Age sent emails from November 19 to December 4 to more than 21,000 retail owners and managers from the Pet Age subscriber list to complete the Internet-based questionnaire. The 2015-2016 Pet Age Retailer Survey drew 442 valid responses with a confidence level of 95 percent and a margin of error of 5 percent, according to Best Companies Group.
Percentages will not always total 100 because many responses were rounded and not all respondents answered all questions.
The Pet Age Retailer Survey was sponsored by Loving Pets (Cranbury, N.J.), PetEdge (Beverly, Mass.) and PetMatrix (Saddle Brook, N.J.).


